Stock Charts For Dummies
Stock Charts For Dummies is an introductory guide to building and interpreting stock charts. It covers candlestick, bar and line charts, chart settings, patterns and trend identification for beginning traders and investors.
At a glance
- Introduces candlestick, bar and line chart types, including their stated pros, cons and best practices.
- Describes chart construction, display settings, technical patterns and trend identification.
- Presented as a guide for beginning traders and investors.
Reference price: $31.99
Price checked: Nov 13, 2026
View offerAhead of Black FridayExplore the selectionOften bought together
Pros and cons
Pros
- Covers three commonly used chart types and explains how chart settings affect what appears on screen.
- Combines chart-building guidance with pattern and trend topics for a beginner-focused introduction.
Technical specifications
9 specifications| Publisher | For Dummies |
|---|---|
| Publication date | Feb. 21 2018 |
| Edition | 1st |
| Language | English |
| Print length | 368 pages |
| ISBN-10 | 1119434394 |
| ISBN-13 | 978-1119434399 |
| Weight listed | 1.05 kg |
|---|---|
| Dimensions | 18.8 x 2.54 x 22.86 cm |
Who is it for?
A good fit for
- Beginning traders and investors learning to build and interpret stock charts.
- Readers looking for an introduction to candlestick, bar and line charts, chart patterns and trends.
Less suited to
- Readers seeking a chart-reading guide with consistently clear visual presentation, since customer feedback is mixed on readability and chart legibility.
Customer reviews on Amazon
- 5 stars
71% 71% - 4 stars
13% 13% - 3 stars
7% 7% - 2 stars
4% 4% - 1 star
5% 5%
Customer feedback describes the book as informative and useful for learning about stock charts, with positive comments about value. Readability is mixed, including reports that charts can be hard to read. That matters for a guide whose subject is visual chart interpretation, so buyers who rely on clear diagrams may want to weigh that concern. Aggregate ratings are generally favourable, but do not explain individual readers' experiences.
Positive themes
- Customer feedback describes the information as useful and informative.
- Some feedback speaks positively about the book's value for money.
Mixed feedback
- Feedback is mixed on readability, with some finding the book easy to understand and others saying the charts are hard to read.
Frequently asked questions
What chart types does the book cover?
The listing says it introduces candlestick, bar and line charts, including their pros, cons and best practices.
Who is this book aimed at?
It is presented as an introductory guide for beginning traders and investors.
Does it discuss building charts as well as interpreting them?
Yes. The listing describes building charts, adjusting display settings and using patterns and trends to inform chart interpretation.
Alternative options

The Trading Code: A Beginner's Guide how to Make Money in the Stock Market and Day Trade for a Living (Canadian Edition)
$21.90

Credit Spread Options for Beginners: Turn Your Most Boring Stocks into Reliable Monthly Paychecks using Call, Put & Iron Butterfly Spreads - Even If The Market is Doing Nothing
$24.95

Stock Market Investing For Beginners: Learn The Basics Of Stock Market Investing And Strategies In 5 Days And Learn It Well (Business And Money Series)
$6.99

Stock Market Investing For Beginners (2 Books In 1): Learn The Basics Of Stock Market And Dividend Investing Strategies In 5 Days And Learn It Well (Investing Bible)
$8.99
The Candlestick Trading Bible: Master Chart Reading, Spot High-Probability Setups, and Grow Your Trading Account Even If You’re Just Starting Out
$49.99

Put Option Profits: How to Turn Ten Minutes of Free Time into Consistent Cash Flow Each Month (Passive Stock Options Trading Book 3)
$11.22
The New Digital Gold: A Simple Guide to Cryptocurrency: A Beginner's Manual for Learning the Basics, Buying, Selling, Storing Safely, Avoiding Mistakes, and Building Smart Investment Habits
$19.29
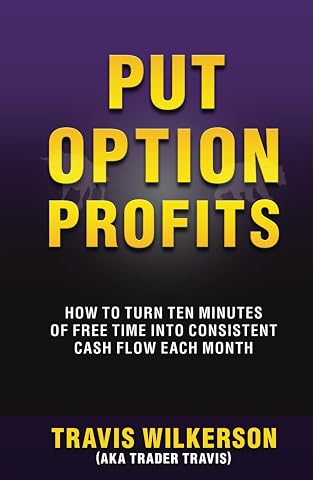
Put Option Profits: How to Turn Ten Minutes of Free Time into Consistent Cash Flow Each Month
$41.98

Dividend Investing For Beginners: Learn The Basics Of Dividend Investing And Strategies In 5 Days And Learn It Well (Business And Money Series)
$6.99